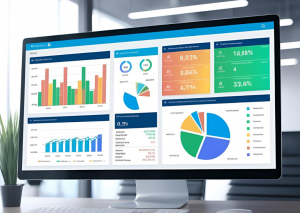
Financial dashboards are most effective for tracking and managing financial data. Their user-friendly layout swiftly allows you to perceive all of your financial information in a single spot. These tools make it simple to produce personalized reports and visualizations that assist you in making well-informed financial management decisions. A comprehensive financial dashboard will compile all of your assets and financial information to provide you with an up-to-date, comprehensive picture of your fortune. You can break down your financial analysis however you see fit, combining this broad viewpoint.

Making your financial dashboard is stimulating because it allows you to track the indicators you want to follow and exclude the ones you don’t care about. However, this implies that your objectives must be apparent before you begin. Therefore, before you start creating your dash, make sure your list is clear and prioritized, regardless of how many goals you have.
Features, Functionality, and Real-Time Insight
A contemporary financial dashboard usually includes tables, charts, graphs, and other visual aids that give you a comprehensive picture of your financial situation. It enables you to swiftly spot patterns in your data and decide how best to allocate resources. You can make sure they are using their money and resources as efficiently as possible by keeping an eye on KPIs in real time.
Financial dashboards are created by gathering data from accounting, banking systems, and other databases. Financial departments must arrange the data into insightful visuals. You can track your financial performance in real time and make any modifications after the dashboard is configured.
Key Metrics and Strategic Dashboard Design
ROI, which calculates the return on cost or investment, is an essential indicator for your financial dashboard. It aids in assessing how well assets have performed over time. However, because this information is not readily available, some people have difficulty determining an appropriate ROI. You must know the amount spent and if the investment was successful to calculate current ROIs properly. Generally, while monitoring existing investments, you may not have a precise ROI. Having an accurate picture of the success of previous investments allows you to make logical decisions based on prior experiences. The financial well-being of a person depends on both measurements.
Creating effective financial dashboards requires thorough data and well-defined goals. Use a methodical approach while creating a dashboard. Establish goals and objectives first by learning about the target audience’s requirements. Divide the dashboard into parts such as comparisons, important financial KPIs, and overviews to describe its structure. Collect data and other inputs, such as budgetary information, sales reports, reports on finances, operational data, and accounting data. Connect to a platform that provides real-time financial insights. You can construct the dashboard using dashboard software, or you can start from scratch and create visualizations incorporating all of the identified data points. With the help of a few members of your target audience, test and modify the dashboard while taking their comments into account. Make sure every image is simple to explore and comprehend.
Usability, Maintenance, and Visual Design
Ensure that every user receives sufficient training when the dashboard is finished, covering topics such as navigating the dashboard and understanding KPIs. Update the dashboard often in response to emerging patterns or fresh data. This guarantees that consumers can always access the most pertinent information. You may build a strong and useful financial dashboard that aids in decision-making and enhances business results by following these steps.
The functions of a financial dashboard are numerous and include data analysis, KPI tracking, and reporting. It should be audience-specific, live, auto-updating, and targeted at a particular subject or objective. An automated dashboard is crucial in a fast-paced setting because it facilitates users’ access to new data from primary financial data sources without requiring manual labor.
A contemporary financial dashboard needs to be interactive, enabling users to immediately alter data and examine it from various perspectives. Users should be able to choose information that is helpful for their particular purpose by having access to pertinent data. You should be advised to create a collection of financial dashboards for various uses.
All of these aspects may make a dashboard a useful tool for decision-makers, giving finance professionals the ability to use their data efficiently and a strong foundation for data-driven business choices. It should be dynamic, audience-specific, and equipped with drill-downs and filters to let users work with data from various perspectives.
Dashboard Accuracy and Strategic Use
Although the financial dashboard is a tool that gives you a broad overview of financial data, it is crucial to make adjustments since it is still learning about your data and organizing it. Regularly checking the dashboard for more specific information is essential. Dashboard alerts give a broad overview of the numbers, while the dashboard itself provides more specific information.
Management should focus on including only pertinent information, such as actual expenses and profit margins, to ensure clear financial reporting and avoid misunderstandings. By doing this, the dashboard won’t become overflowing with pointless data.
Bright colors and graphs are examples of visual aids that may assist in drawing attention to the dashboard and making information simpler to access. Users can locate what they need more quickly if they experiment with the colors, graphs, and general style. You should design the financial dashboard to offer precise and practical data.
It is advised that strategic dashboards be created every three months. Anything above that frequency will become specific operational metrics and measurements. An operational dashboard is fine, but it will probably work better for the financial operations team than the executive or strategic teams. Quarterly is ideal for strategic, high-level financial dashboards.